Image
Key points
- We've had a good month for bringing in new sponsors, monthly donations and individual members 🥳
- While expenses were higher this month, they were anticipated.
- There were 16 new contributors and 347 contributions in total this month
- The Mautic trials are well underway with over 500 signups to date
Finances
Income
This month saw two new members coming on board - Acquia at the Gold tier, and the Drupal Association at the Bronze tier. A big thank you to both organizations for supporting Mautic's growth!
We also received just over $1,500 in monthly donations and three individual members joined Mautic this month. We had a small credit from a membership refund and also a single one-time donation.
Thank you everyone for continuing to support Mautic's growth!
| Description | Amount |
|---|---|
| Corporate membership | $20,000 |
| Monthly sponsors | $1,541 |
| Individual members | $244.45 |
| Credit from refund | $13.98 |
| One-time donations | $10 |
| Total | $21,809.43 |
Expenditure
This month we've had some increases in host fees due to the income from memberships. Infrastructure is also slightly higher on account of the renewal of our social media scheduling tool HeyOrca at $894 and multiple domain name renewals ($76.96).
We have the last of the travel expenses covering the FOSS Backstage event, which were approved and paid in April. We've also got the annual renewal of our virtual postbox (which allows Mautic to have a physical address to receive mail). One membership was refunded when it was incorrectly applied to a company rather than an individual, which is also reflected.
| Description | Amount |
|---|---|
| Employment costs | $8,897.09 |
| Host fees | $2179.55 |
| Infrastructure | $1334.51 |
| Travel expenses | $958.81 |
| Admin | $299.69 |
| Events | $298.50 |
| Payment processor fees | $261.84 |
| Refund | $100 |
| Total | $14,329.99 |
Contributions
Organizations
Most active companies
Dropsolid 372 (⬇️ 7.92%)
Acquia 365 (⬆️ 98.37%)
Leuchtfeuer Digital Marketing 185 (⬆️ 69.72%)
Twentyzen 147
Leancept 94 (⬆️ 67.86%)
Stefan Franz 67
Webmecanik 60 (⬇️ 39.39%)
Comarch 52 (⬆️ 57.58%)
Matic Zagmajster s.p. 44
Friendly 44 (⬇️ 30.16%)
Top contributing companies
Acquia 79 (⬆️ 125.71%)
Dropsolid 48 (⬆️ 92%)
Devsadda 26 (⬆️ 420%)
Leuchtfeuer Digital Marketing 22 (⬆️ 266.67%)
Webmecanik 19 (⬆️ 72.73%)
Comarch 17 (⬆️ 21.43%)
Friendly 5 (⬆️ 400%)
Leancept 4
Twentyzen 3
Druid 2
Contributions are as defined here with the addition of Jira issues being closed as completed, GitHub Pull Request reviews and Knowledgebase articles being written or translated, which we track through Savannah’s API.
Want to appear on this list? Get contributing, and drop me a line with your company name, domain and the folk who work for you and we’ll make sure that you are attributed correctly!
A big thank you also to all the individuals who are helping us build this awesome community!
Individuals
Most active contributors
John Linhart 340
Anderson José Eccel 197
Dirk Spannaus 147
Lenon Leite 124
Jakob Persson 94
Rembrand Le Compte 70
Stefan Franz 67
Mattias Michaux 60
Zdeno Kuzmany 54
Ekke Guembel 45
Top contributors
John Linhart 73
Anderson José Eccel 29
Rahul Shinde 26
Zdeno Kuzmany 18
Lenon Leite 10
Patryk Gruszka 9
Rembrand Le Compte 9
Peculiar Umeh 8
Destiny obamwonyi 6
Ekke Guembel 5
Welcome to our new contributors this month 💖
Destiny obamwonyi
Peculiar Umeh
Tosin Akinbowa
Tom-Woef
marcus42
Asme
Jakob Persson
Ivan Kosutic
Princekumar Abhangi
mcphil
adrianoxy
Patrick Robertson
Gowtham Chandrasekaran
jjarrett
Satyam Verma
Xabi Tranche
Top supporters
John Linhart 8
Dirk Spannaus 3
Jakob Persson 3
marcus42 2
Andy Towne 1
Anderson José Eccel 1
mcphil 1
jjarrett 1
Tosin Akinbowa 1
adrianoxy 1
Usage of Mautic
Mautic Trials
We continue to see growth in Mautic installs via Composer, with over double the number of installs in April compared with December 2023.
Since launching the Mautic Trials at the end of March, we've had over 500 signups which shows a strong interest in Mautic.
With the addition of the Trials call to action button, we also set up some events in our Analytics platform which tells us that this month we have around a 10% click through rate on the homepage trials button, with a 23% conversion rate and 65% completion rate (where the user has confirmed their email address and started the trial).
Image

These metrics allow us to track the performance of our call to action and improve going forward. We have also implemented at the end of April an open source product analytics tool, Posthog, to better understand how users are exploring their trial environment, so we will also begin to report on these where relevant going forward.
We ask for some basic information on the signup form which you can view in this screenshot:
Image

It's interesting to see that just over 45% of people trying out Mautic are from businesses with under 50 employees, and that only 41% are considering using it for business purposes.
While we're still gathering feedback and insights from trial users, it's clear that giving people a quick and easy way to 'kick the tyres' is enabling people to more quickly see the power of Mautic.
Thus far we have two conversions to paid accounts and several more conversations happening with trial users - as a recap, the Mautic project receives 40% of the revenue from the first year of all trial users who become a paying customer, so we are hoping this soon becomes an additional revenue stream for the project.
Usage stats
We continue to see stable numbers of people downloading Mautic via the mautic.org/download form, averaging around 1300-1500 per month.
Composer-based installations are continuing to growth month-on-month with just over 3,000 installations being reported by the stats available from Packagist and nearly 19,000 pulls of the Mautic API library.
Image

We've now exceeded 41,000 live instances of Mautic tracking being deployed on websites, which is extrapolated very roughly as an indicator of the number of Mautic instances.
Image

We continue to see strong quarterly growth in active deployments of Mautic tracking - already sitting at 5% growth on last quarter after only a month - and we're seeing a reversal of the trend we had been seeing of more sites removing Mautic tracking than adding it.
The chart below shows the net added/removed by quarter and you can see that other than a dip in Q4 2023, we seem to be moving much more consistently in the positive direction.
Image

Community Health
Traffic to the Mautic web resources is continuing to return back to around 30,000 new users per month. We also continue to see individuals and new companies getting involved in the Mautic community at a rate of around 10 new companies per month.
This month we saw 16 new contributors getting started with giving back to Mautic and 347 total contributions across the project, which is awesome! Whether that's providing a solution to a forum post, fixing, testing or reviewing a bug fix, writing content or creating images for social and email communications or even helping to pull the stats for writing this report, it all helps to keep Mautic moving forward.
We're also over the 8,000 total members who have been active in the community!
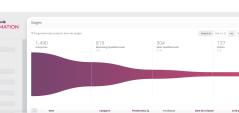
We're also seeing a very gradual widening of our pyramid of engagement when we consider the project as a whole where people join as a member, then start to engage, then contribute, and then finally move into some of the top contributors in the project. The following pyramid shows the whole project since 2014:
Image

The aim is that we start to widen the Participant and Contributor sections, so that more people are taking an active role in the project. This change is happening very slowly, but we have plans for improving our contributor onboarding in the pipeline which we hope will accelerate this further.
Conclusion
We've had a good month in April, with new members and ongoing sponsorships bringing us closer to our financial growth targets. Mautic is continuing to grow in adoption and community engagement, and the new trials provision is enabling newcomers to Mautic to get started quickly, lowering the entry point for new users and curious marketers.
As we start to learn more about how people are using Mautic during their trials I'm excited to see how we can use the information to further develop Mautic as a project.